
Data handling
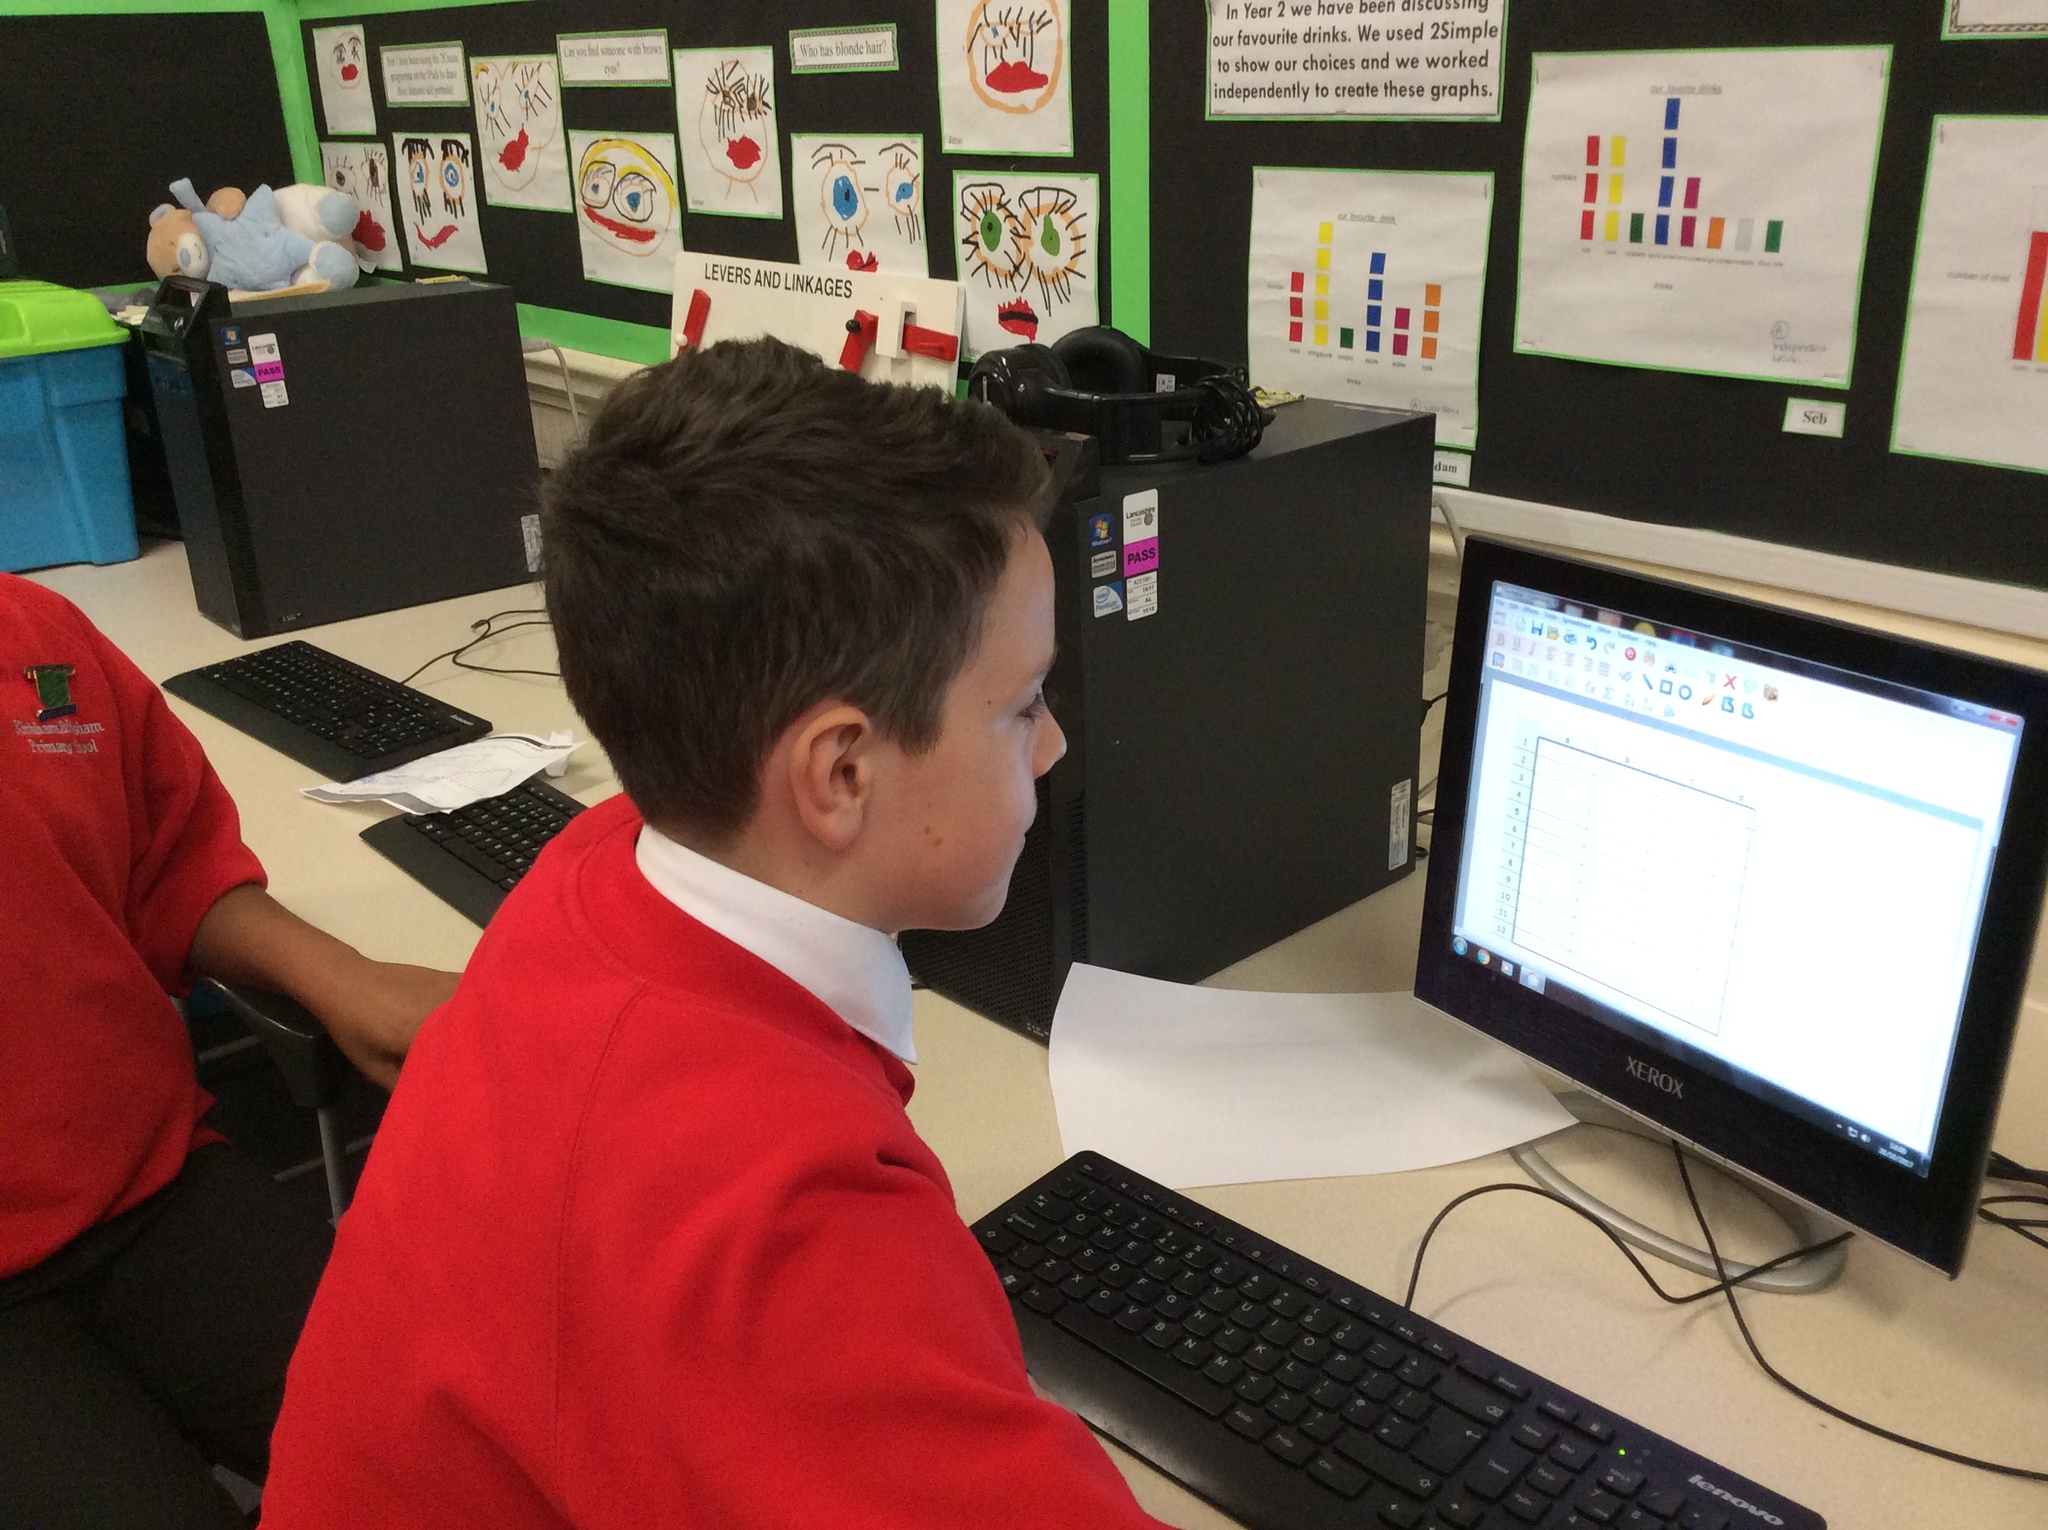

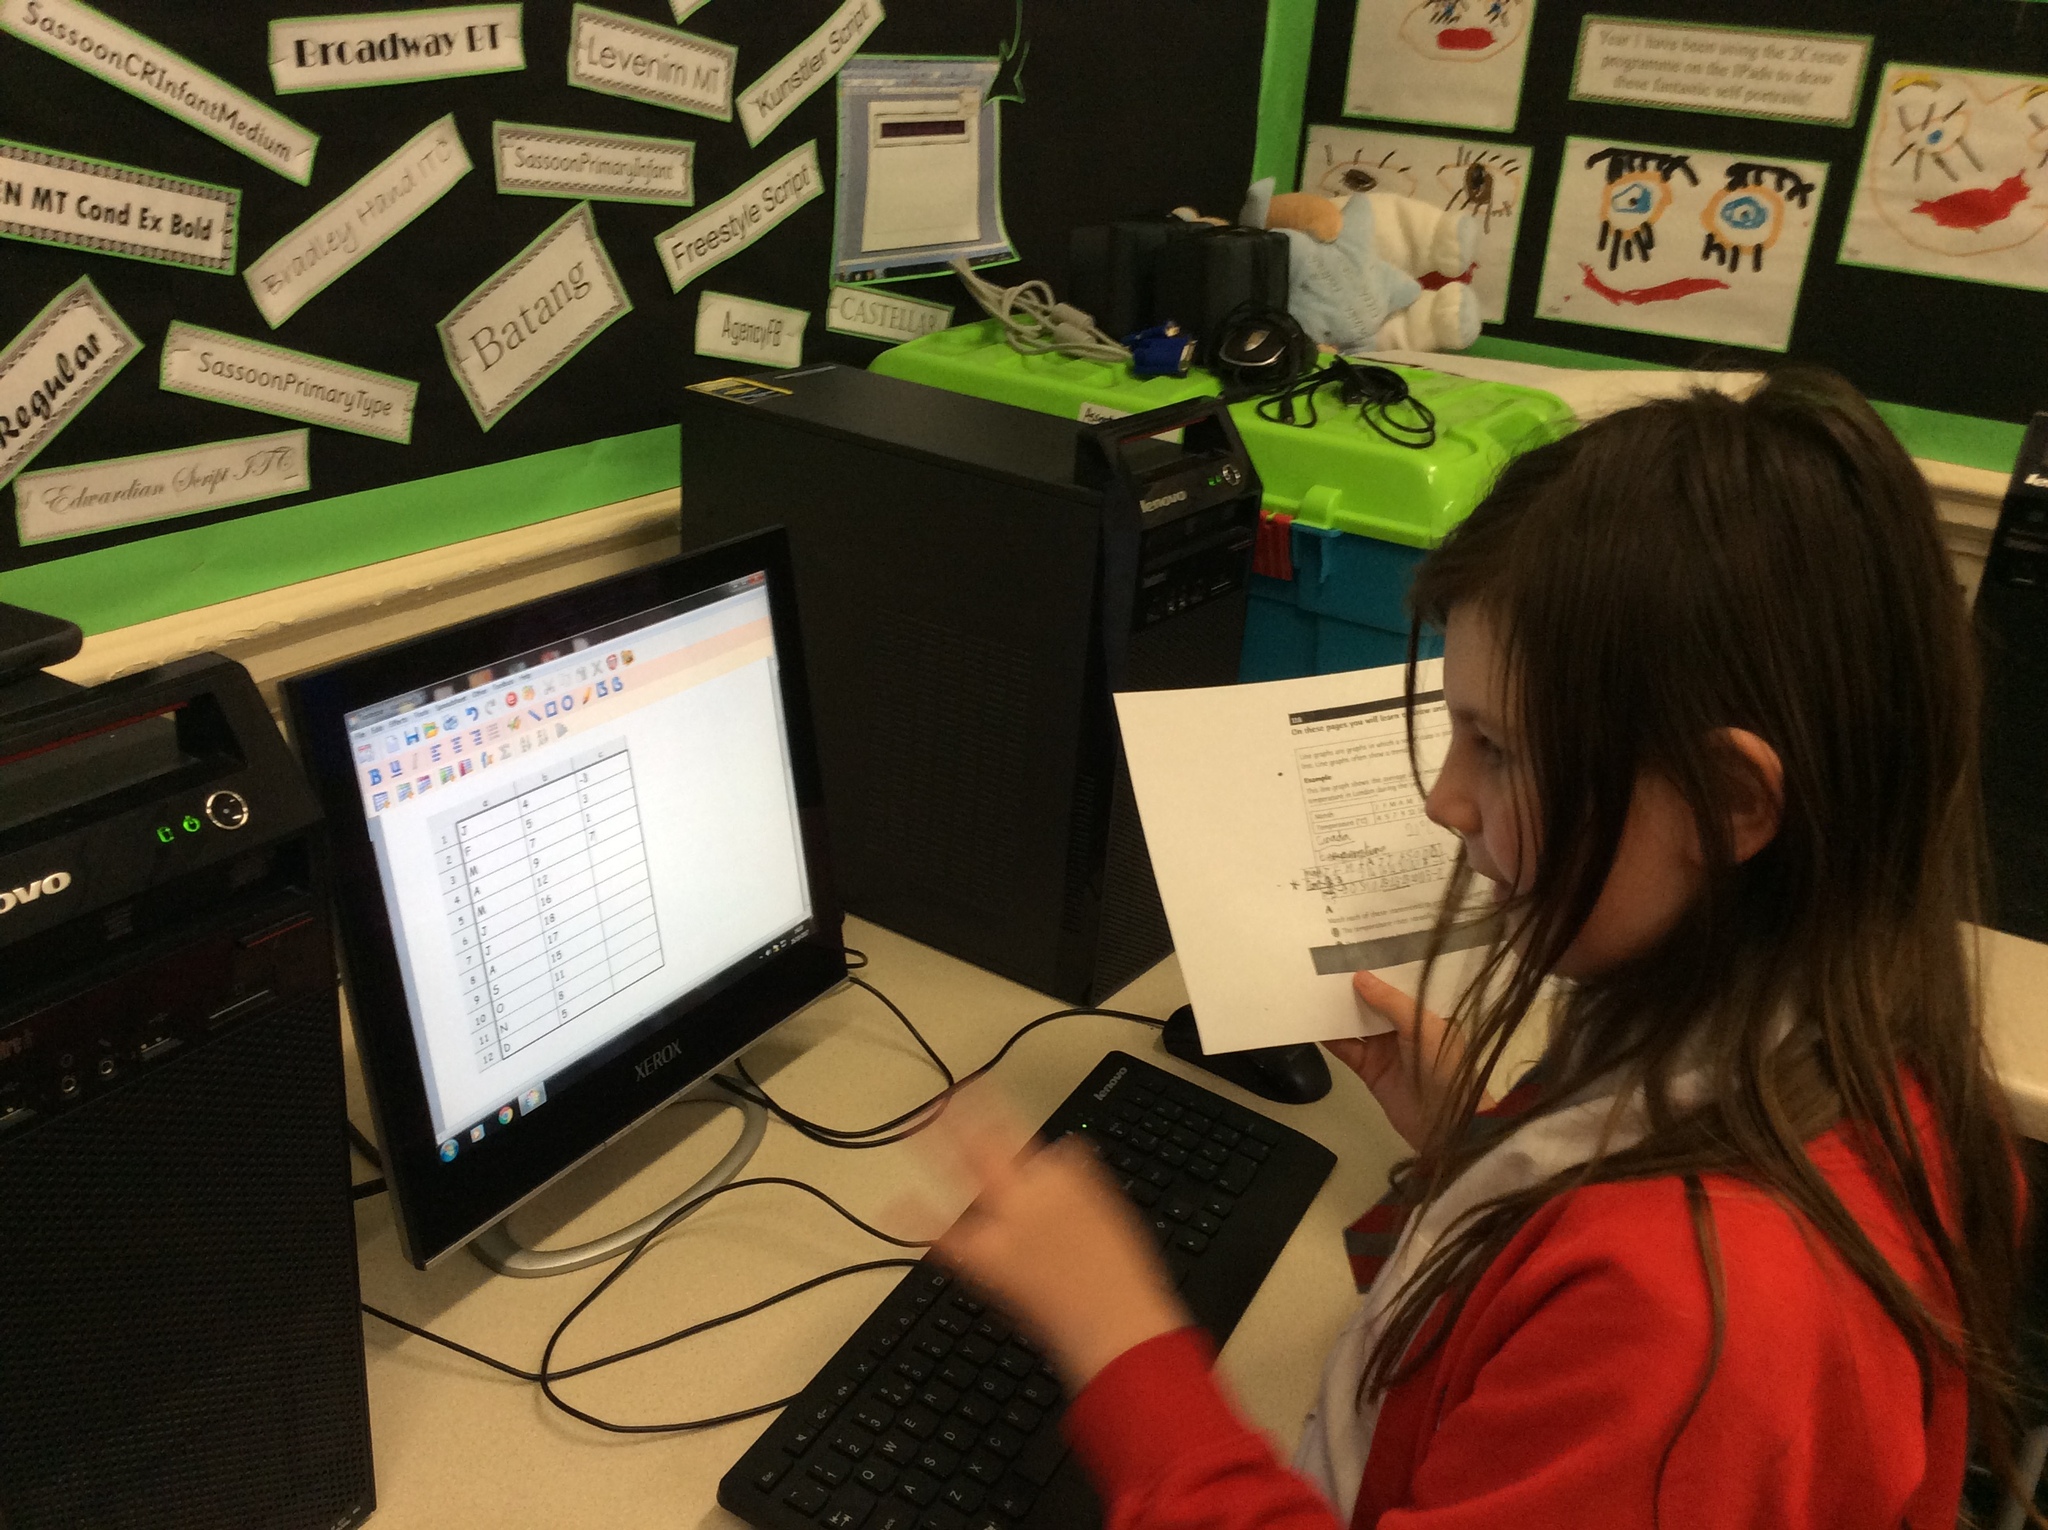
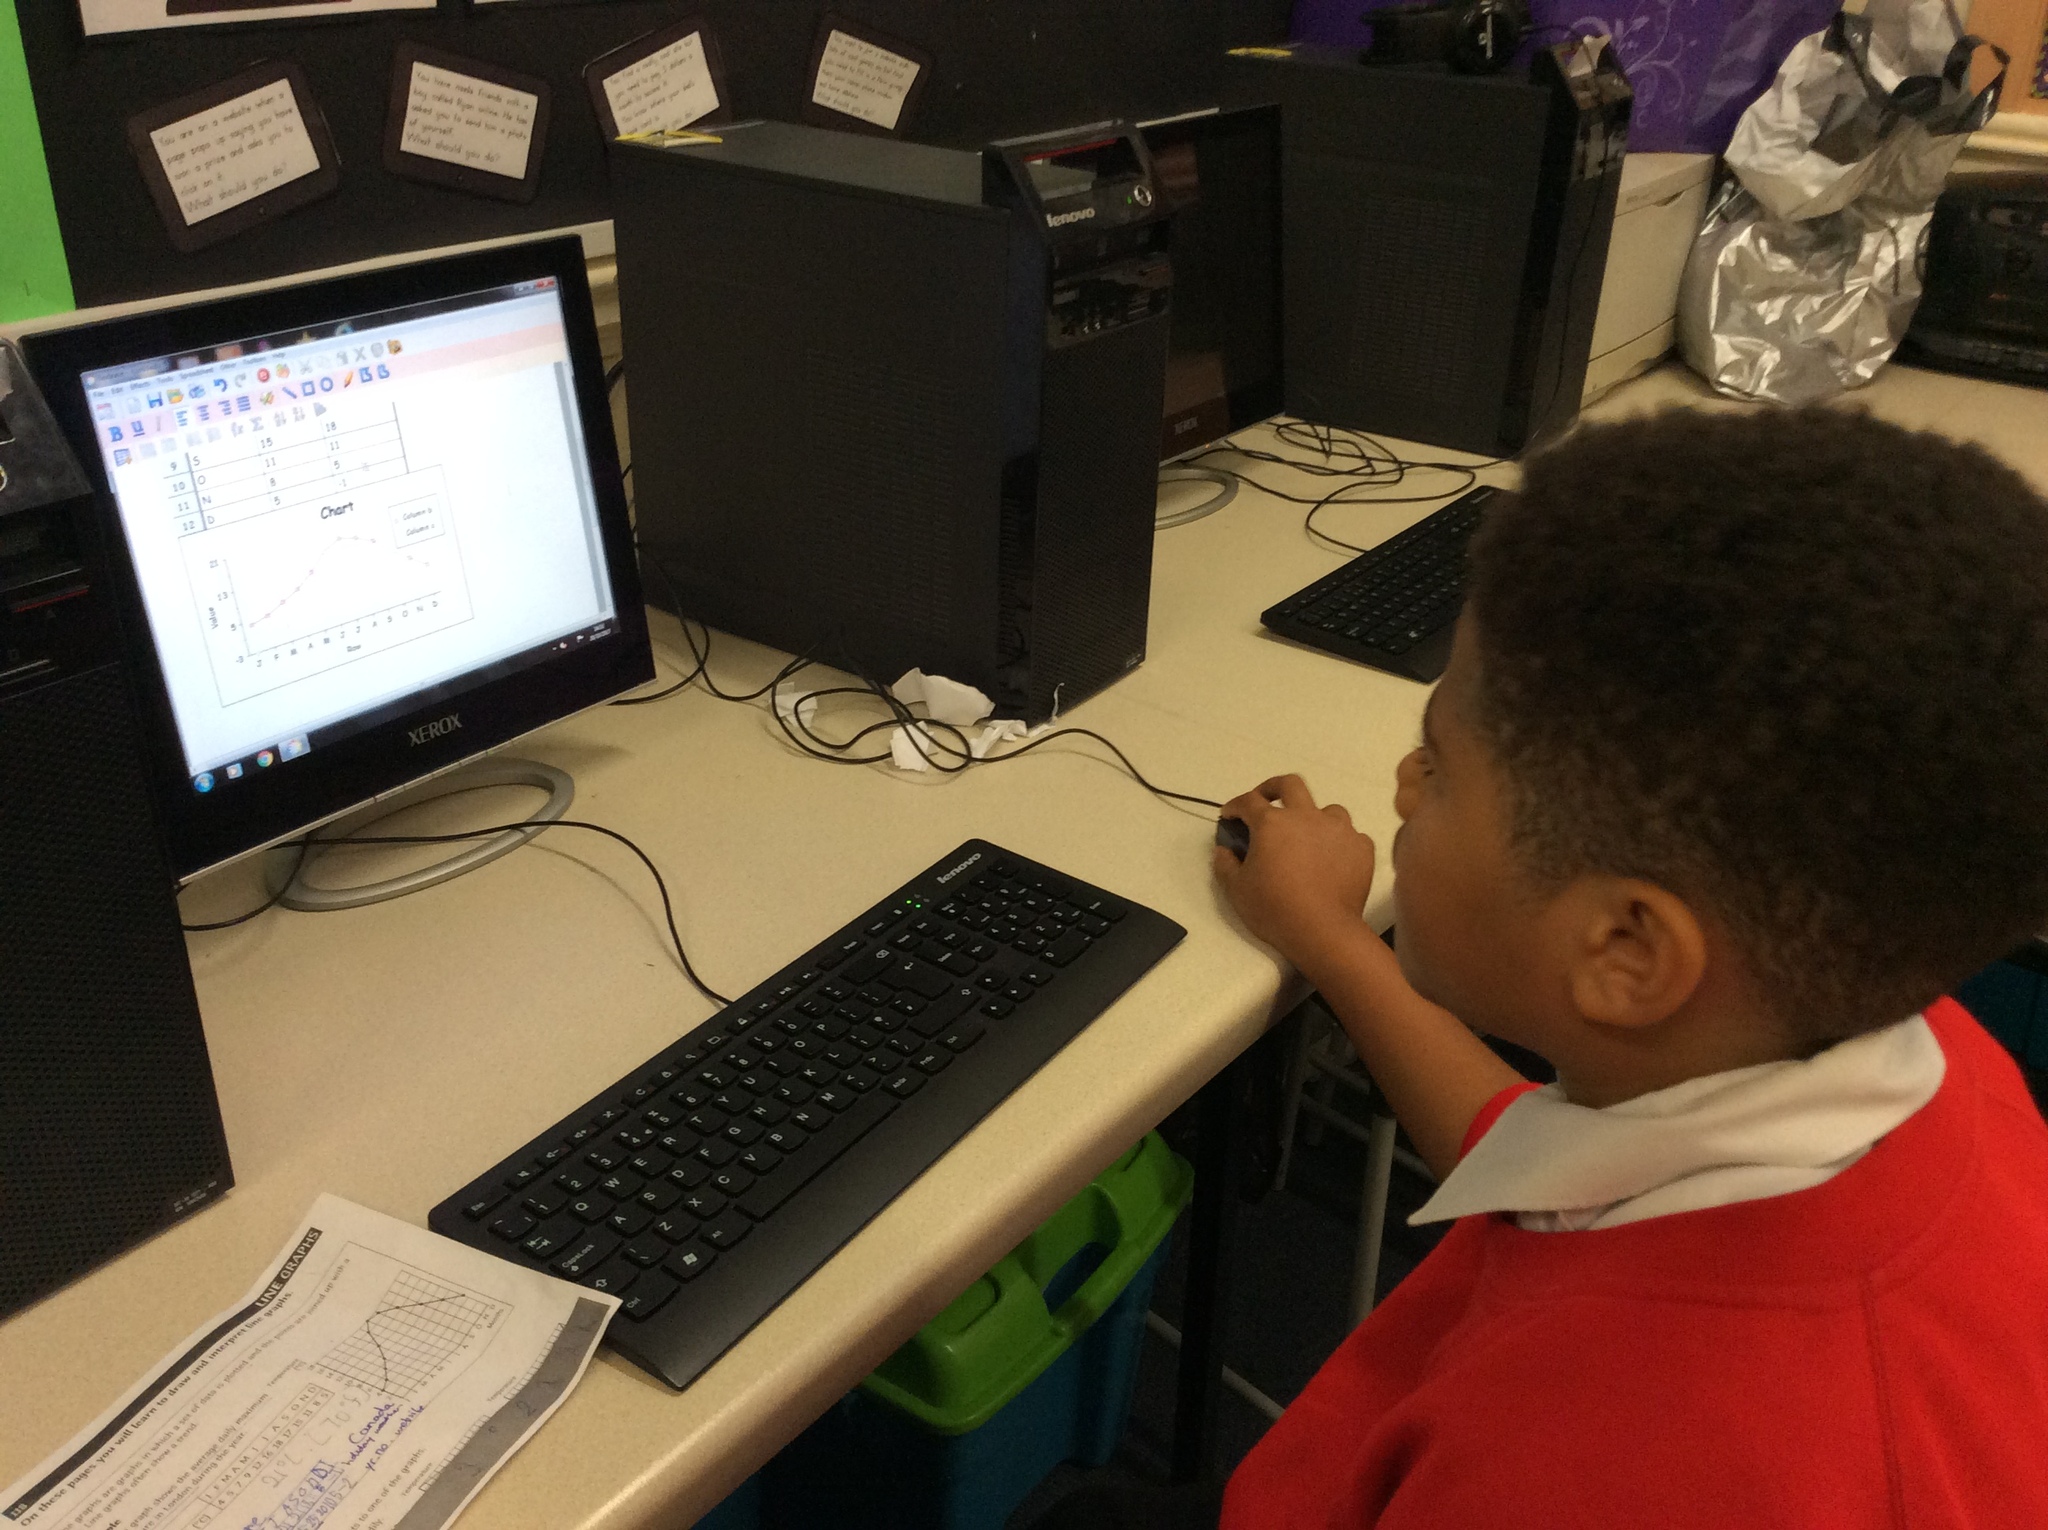
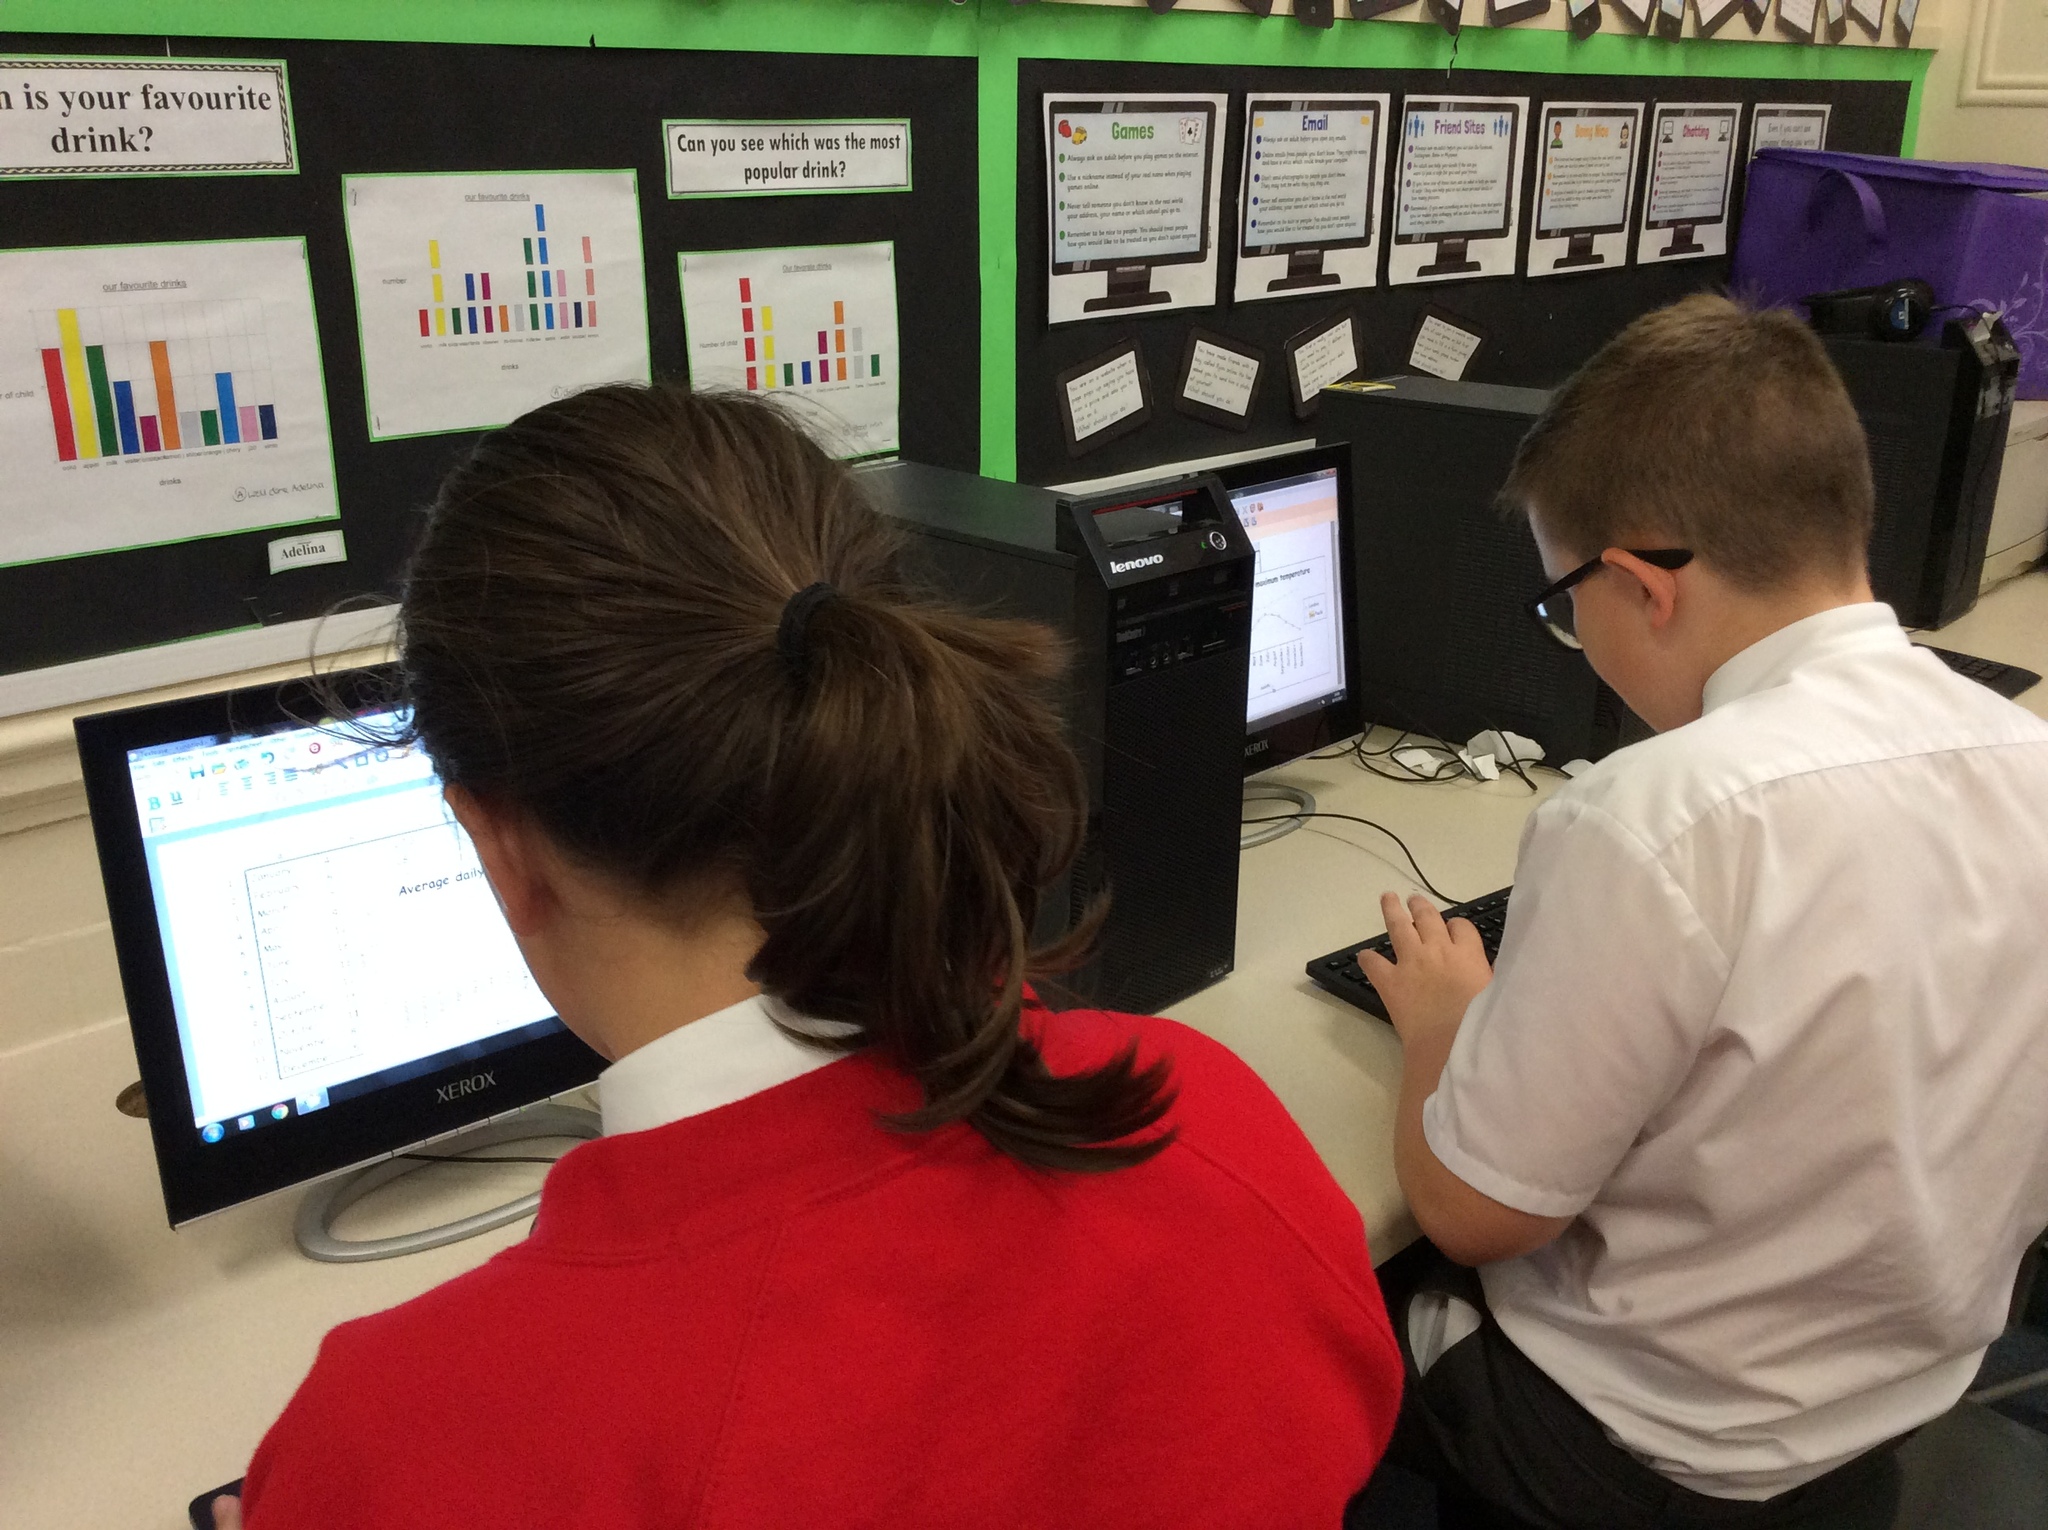
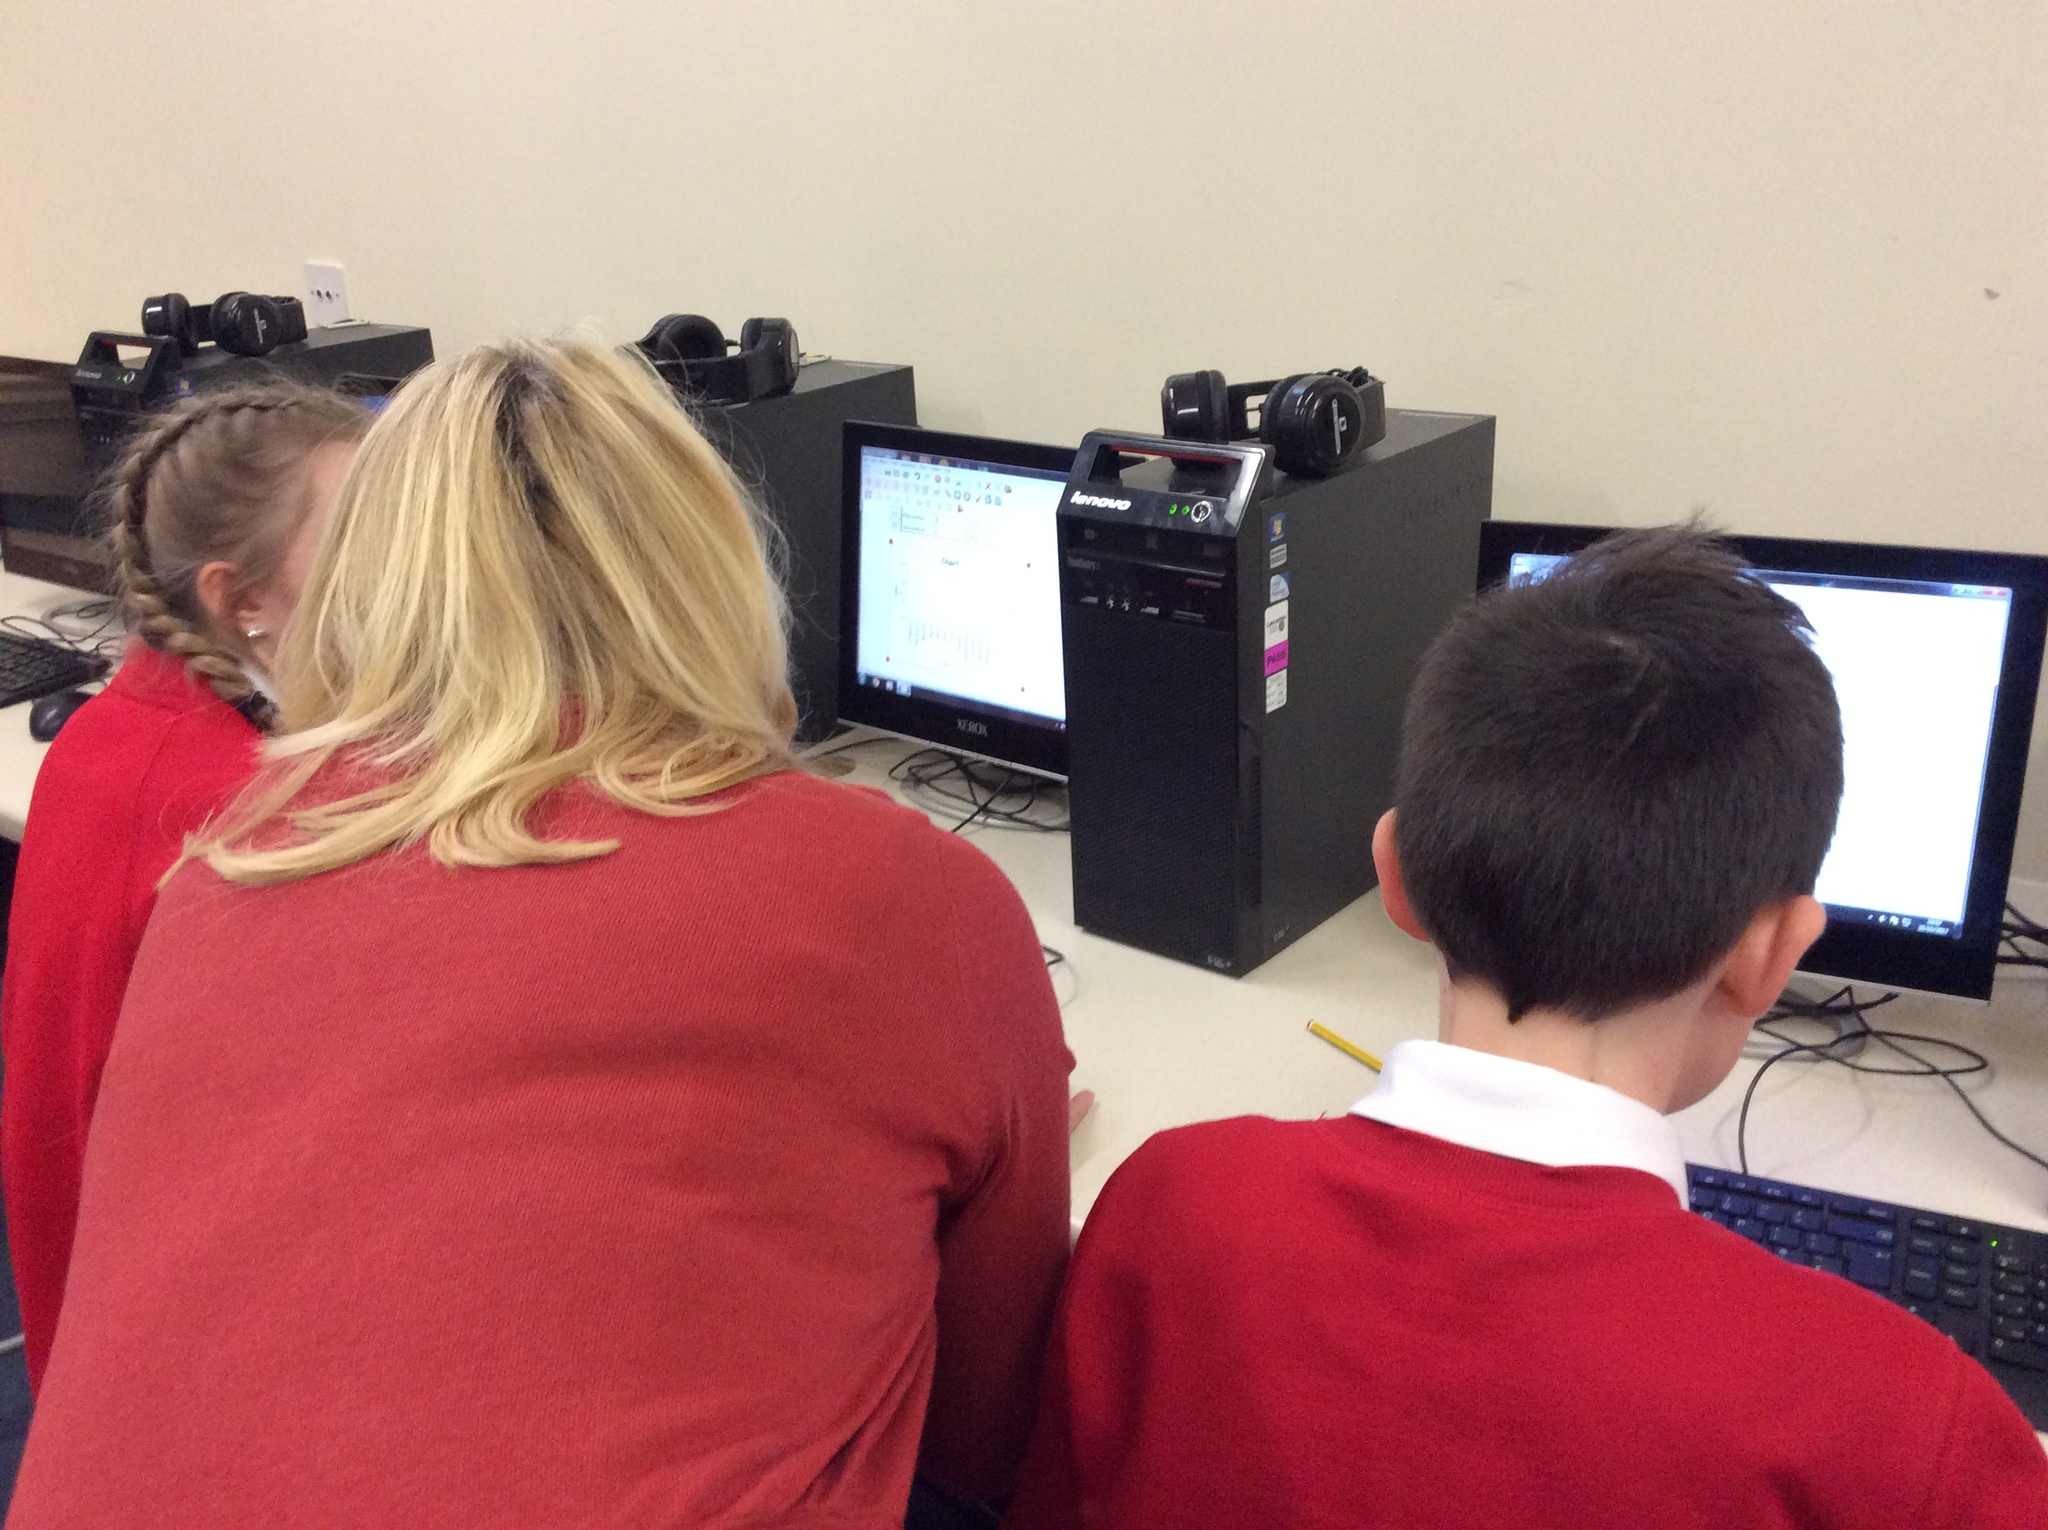

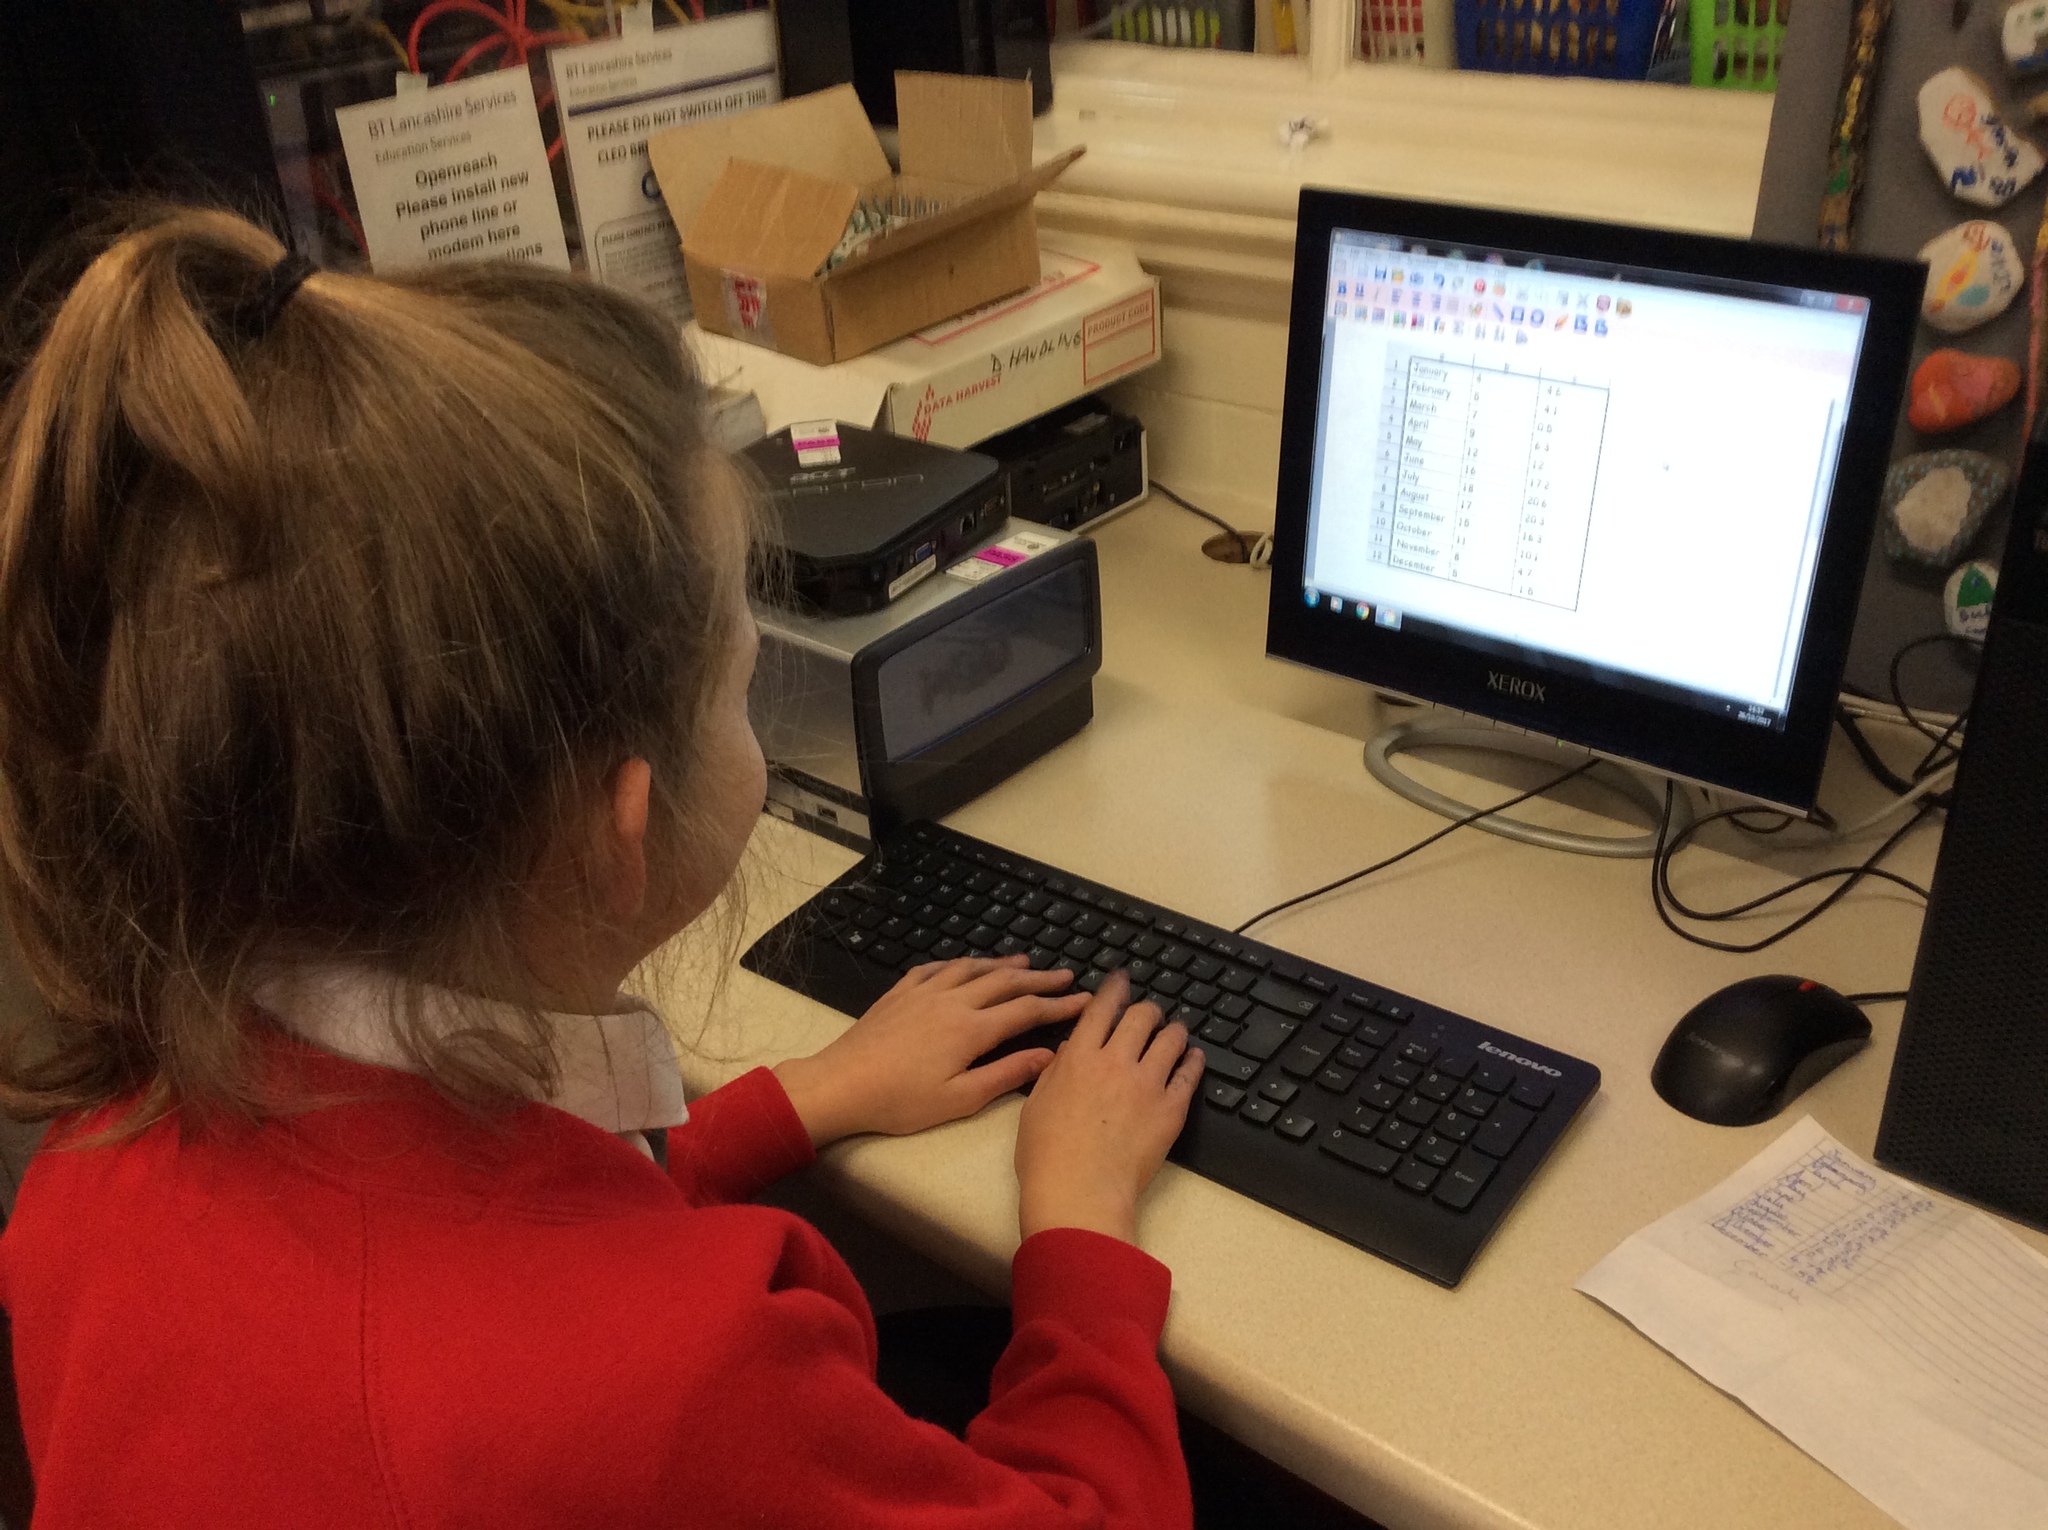
In Year 6 we have enjoyed learning lots in ICT. Our learning objective was to present data in a line graph for two cities in the world. First we had to search for this data using a search engine eg Google, Bing. We had to be very precise with what we typed into the search engine eg the average daily maximum temperature in London. Next we had to cross check the accuracy and reliability of the information on two different websites so that the most accurate data could be graphed. Finally, we used Textease to graph the data. We could all interpret our line graphs and understand the trend it showed.
.PNG)