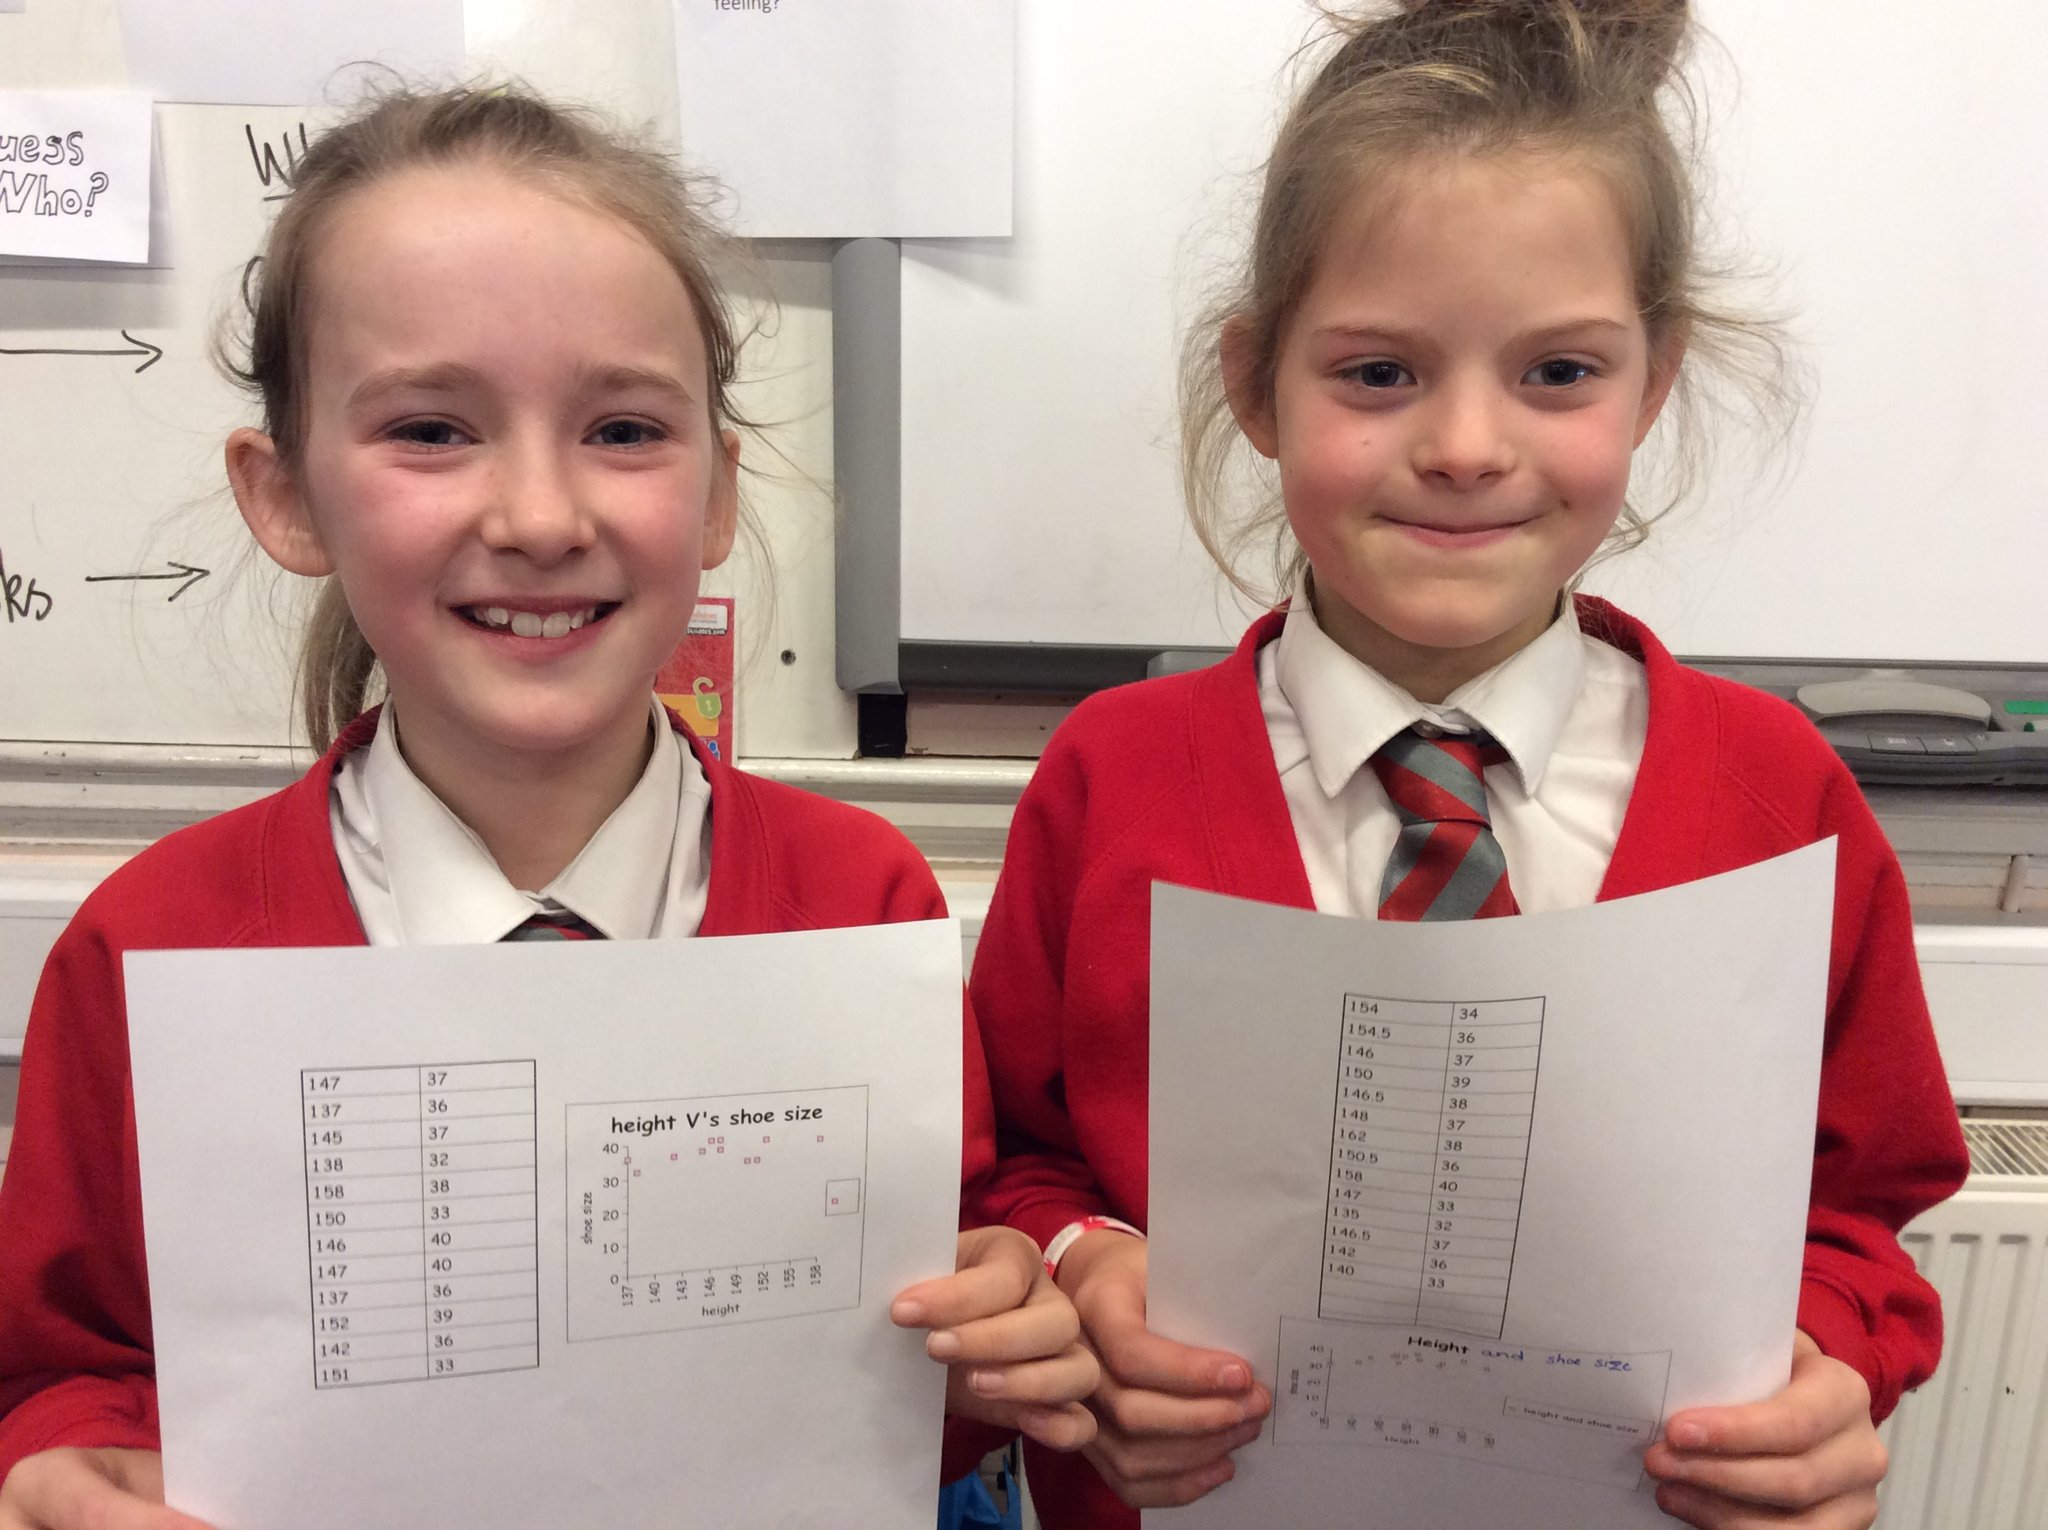
measuring height scatter graphs


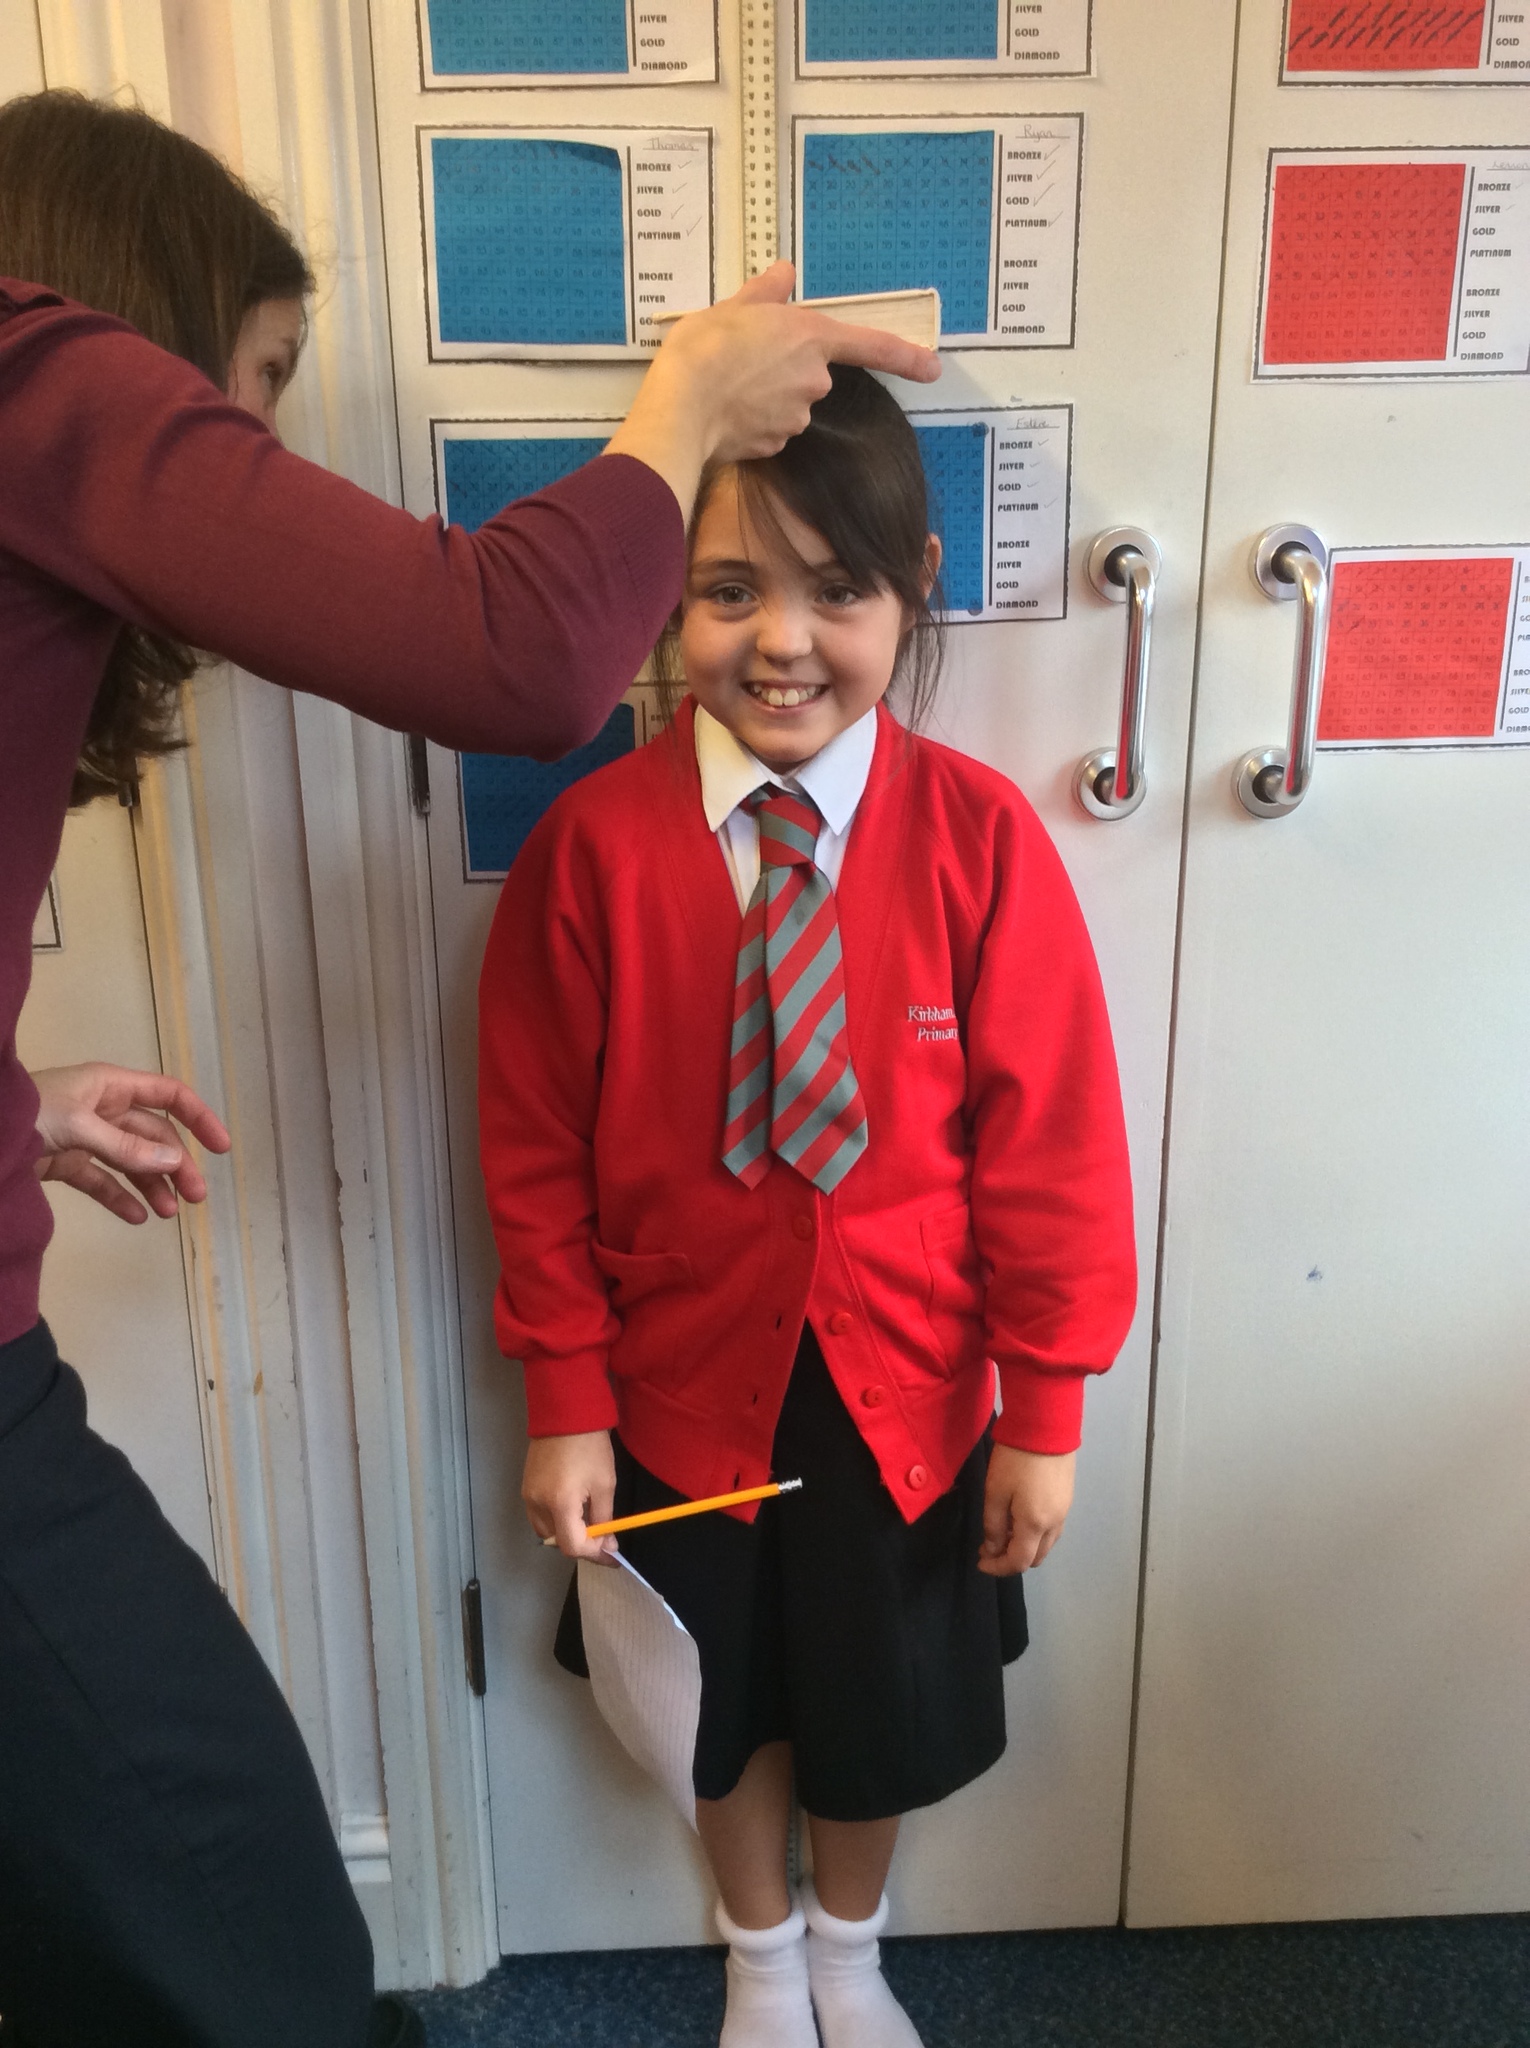
We have had lots of fun collecting data for our scatter graphs. We measured our height and asked each other our shoe size to see if the two are related. You can see that all the points representing height and shoe size lie approximately along a straight line. This shows that there is a correlation between these two variables.The points lie close to a straight line, which has a positive gradient this shows that as one variable increases the other increases. So as we grow taller our shoe size gets bigger!
Previous